Two Schools of Population Analytics


by Serelora
This article was originally published on Medium.
Read full article on MediumEpic learns from the records that already exist. Serelora builds the record so each patient can be read first. Our fetal growth research shows why the order matters.

By Luis Cisneros, CEO of Serelora
A patient’s care should not depend on which clinical framework her doctor happens to use. It also should not depend on whether she finds a second doctor who knows what that framework misses. Today it often does. Knowledge in medicine still travels by habit, by referral, and by who happened to read which paper. It rarely travels through the medical record itself. This essay is about changing that. It is also about two schools of thought on how to learn from patients at scale.
The first school is the one Epic has built. It is the most serious effort in American health care to learn from records in aggregate. The second is the one we are building at Serelora. Both want the same thing, better outcomes for more people, delivered more equally. They differ in where they start.
Epic starts from the records that already exist and learns from them in bulk. We start from the individual record. We build it so it can be read against the evidence at the moment of care, and we aggregate only after that reading. The difference sounds technical. In our fetal growth research, it is the difference between a risk signal that sat in the chart from the first visit and a diagnosis that came weeks later, or never.
The school Epic built
Epic’s approach is easiest to understand as a sequence. The first step is to gather. Cosmos combines de-identified records from health systems that use Epic, now roughly 320 million patients.
The second step is to learn. Epic Research publishes observational studies from that data, and Epic’s newer models go further. CoMET, built with Microsoft and Yale, was trained on 118 million patients and 115 billion medical events. It learns to predict the next event in a patient’s timeline. Curiosity, the product built on that work, forecasts outcomes such as readmission and stroke risk and is being validated at about 20 organizations.
The third step is to bring the pattern back to one patient. A look-alike tool compares a patient’s case against similar cases in Cosmos. Best Care uses real-world data about similar patients to support decisions at the point of care.
This is real work, and some questions can only be answered this way. A rare disease needs a national network to find a second case. A treatment comparison needs millions of rows. Epic’s scale makes those possible, and it should keep doing them.
The limit of this school follows from its starting point. A model trained on records learns what clinicians did and wrote down. It sees the patient only through that filter. Where the record is complete, the filter is thin. Where it is not, no amount of scale fills the gap.
Cosmos includes social needs such as transportation and financial security, but only where an organization asked about them. A 2025 study of about twelve million adults with type 2 diabetes in Cosmos measured how often that happened. After adjustment, individual social determinant elements were documented for 11.2 to 31.5 percent of patients, and less often in several racial and ethnic groups. Neighborhood indices built from home addresses, by contrast, were available for nearly everyone.
So the aggregate knows the census tract. It usually does not know whether this person can leave work for an appointment or afford a prescription. Those are the things that decide whether prevention actually happens.
The school we are building
We start from the other end, and the first job is capture. Clinical facts and social circumstances are recorded as structured facts while care happens. Each fact has a value, a date, a source, and a status, plus the context needed to interpret it later. A transportation problem is recorded as a transportation problem. A denied authorization is recorded as a denial, with the payer’s reason, instead of showing up later as a test that was never done. If a question was never asked, the record says the answer is unknown rather than leaving a blank that looks like a no.
The second job is reading. When the physician asks, Serelora evaluates the patient against every relevant, evidence-supported framework and shows which ones apply. It shows which criteria are met, which are not, what is still unknown, and where the frameworks disagree. The measurements and the supporting evidence sit alongside each result. The physician decides whether further evaluation or a change in care is warranted.
A condition that a model inferred from the chart is kept separate from a condition confirmed by a finding. The physician can move it from one status to the other.
The third job is aggregation, and it comes last. In this school, a population is a set of patients who have already been read the same way. Phenotypes and clinical identities form from those readings, not from keywords in a national extract. Scale still matters. It comes from many practices using the same structure, not from pooling whatever each practice happened to type.
Two schools, like two guidelines
The clearest way to see how these schools relate is to look at a condition where medicine already has two schools of its own.
Fetal growth restriction is diagnosed differently depending on which framework a physician follows. The Society for Maternal-Fetal Medicine, in Consult Series #52, sets the diagnostic trigger at an estimated fetal weight or abdominal circumference below the 10th percentile. The international Delphi consensus, adopted by ISUOG, adds a second path. A fetus whose growth falls by more than two quartiles can meet criteria for late-onset restriction while still measuring above the 10th percentile, as long as that fall is joined by size or Doppler findings.
Both frameworks use the same measurements. They weigh one risk driver differently, size in one and trajectory in the other. Both are trying to prevent the same outcome.
Population analytics has the same shape. Epic’s school weighs volume and the sequence of recorded events. Ours weighs the completeness and context of each record. Neither is wrong, and each sees something the other misses. One framework is not the whole assessment for a patient, and one school is not the whole assessment for the field.
We did not start with this analogy. We found it in charts.
What 32 charts showed
For the past several months we have worked with Dr. Chukwuma Onyeije, Serelora’s CMO and Medical Director at Atlanta Perinatal Associates, on a retrospective study of fetal growth restriction in his practice. We began with 1,043 de-identified records, and 244 remained after initial screening. Of those, 76 had a documented diagnosis of fetal growth restriction, and 32 of those pregnancies ended in a documented adverse outcome. We loaded the 32 into Serelora as structured patients and read every chart against SMFM Consult Series #52.
The first pass over the larger set already showed why structure matters. When the 244 records were first reviewed, co-diagnoses were tagged by searching the notes for keywords. By that method, 84 percent of the growth restriction records carried at least one other diagnosis. Hypertensive disease was the most common at 49 percent, followed by fetal anomalies, preterm or cervical concerns, and multiple gestation.
Those tags were useful for finding charts. They were not findings. A keyword that says hypertensive is not a verified blood pressure history, and a model trained on keyword tags learns the documentation rather than the disease. That is the difference between an inferred condition and a confirmed one. It is also a difference a national extract has trouble seeing.
Reading the 32 charts one at a time told a clearer story. In the first ten, five fell outside the scope of the size-based guideline entirely. Three were monochorionic twin pregnancies and two involved chromosomal abnormalities, and each of those follows different rules.
Five singleton pregnancies were covered by the guideline. Four of them had hypertension, obesity, or a prior placenta-related loss documented at the very first visit. None of that moved the fetal growth plan, because the guideline’s trigger is fetal size.
In three of those five, the size criterion was finally met between 32 and 36 weeks, with no earlier growth scans in the chart. In the other two it was never met. In one of those, the placenta failed while the fetus still measured at the 17th percentile. The remaining 22 charts followed the same pattern in the same proportions.
The most important finding is also the plainest. In these charts, the criteria were largely followed, and the outcomes were still adverse. Physicians did not ignore the guideline. The guideline waited for a late signal while an earlier one sat in the chart from the first visit. Diagnostic delay in these pregnancies was built into the trigger, not into the physician.
One pregnancy, read against the evidence
A single pregnancy from Dr. Onyeije’s practice shows what this looks like up close. Over four weeks, the estimated fetal weight fell from the 40th percentile to the 18th. Four weeks later it measured at the 19th, and the note described borderline growth. No Doppler was ordered.
About three and a half weeks after that, the fetus measured at the 8th percentile for weight and the 6th for abdominal circumference, and fetal growth restriction was diagnosed. Aspirin was added at 29 weeks, past the window ACOG recommends for starting it.
Read against SMFM #52, the chart was quiet until the diagnosis, because the fetus stayed above the 10th percentile. Read against the Delphi criteria, it was still quiet. A fall of about 22 points is short of two quartiles.
Both published frameworks were satisfied, and the pregnancy was deteriorating in plain view. A record built for reading would not have manufactured an alarm from that. It would have shown the physician something more useful. Neither trigger had fired. The trajectory sat in a zone both frameworks leave open. The one test that could resolve the question, an umbilical artery Doppler, was missing.
The right response was never an earlier delivery. A trajectory warning is not a diagnosis, and a diagnosis is not an indication for delivery. The right response was the next test, ordered at the visit where the chart said borderline.
Why the Doppler was missing
Across the charts, the most common omission was an umbilical artery Doppler before the size criterion was met. Growth scans were a different story. When hypertension was on the chart, they were covered and done, sometimes more often than needed.
Our working hypothesis is that the Doppler was usually missing for a coverage reason. Insurers that follow the guideline tend not to approve it until growth restriction has been diagnosed or another finding is abnormal. The late trigger in the guideline becomes a late trigger in payment, and then a late trigger in practice.
We keep that hypothesis separate from two others. One is that the threshold itself is set too late. The other is that some patients arrive late or miss visits. That is real and has to be counted, not explained away.
Testing the coverage hypothesis requires something most records cannot supply. For each Doppler that was indicated and not done, you need the order, the payer’s decision, and the payer’s reason, next to the patient’s visit history. Our first chart reports did not contain those.
In a national extract, the missing Doppler appears at best as a test that did not happen. In a record built at capture, the denial is a fact with a date and a payer rule attached, and the hypothesis can be tested directly. This is the practical difference between the two schools. One can count the missing test. The other can say why it was missing.
What a population looks like from this side
Aggregation in our school begins by splitting before it pools. The five out-of-scope charts made that concrete. Monochorionic twins and chromosomal abnormalities follow different rules and should never be averaged together with singleton pregnancies. The co-diagnosis mix made the same point from another angle. Only 16 percent of the growth restriction records were isolated, so “fetal growth restriction” as a single label hides several populations.
The next stage pools the individual readings. Each patient gets a care gap report that sets the chart against SMFM #52 and records where care diverged from it. The report does not assume that a divergence caused harm. Pooled across the cohort, the reports show whether the recurring pattern sits in how physicians practiced or in the criteria themselves.
If differences in practice are too small to explain the outcomes, the gap is in the criteria. The missing criterion is then most likely the signal no one currently treats as a trigger. That is what a population can produce when it is built from patients who were read first. It does not produce a forecast. It produces a specific, testable claim about what the guideline leaves out.
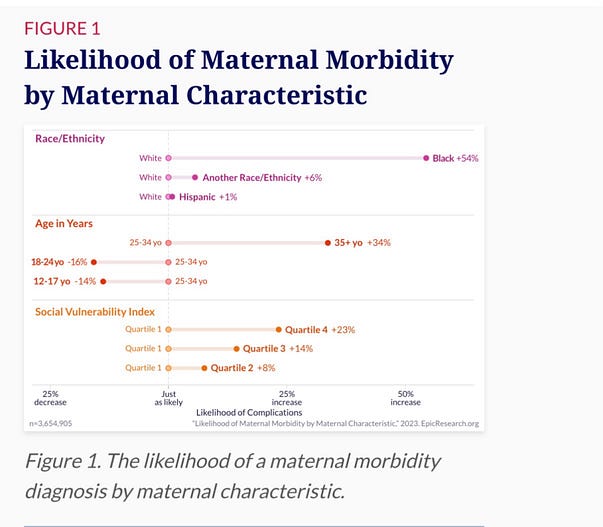
This matters most for the patients the current system serves worst. In 2022, the fetal mortality rate for Black mothers in the United States was 10.05 per 1,000, more than twice the rate of 4.48 for white mothers. Much of what drives that gap lives in person-level circumstances. Whether a Doppler was approved. Whether a patient could get to the next scan. Whether risk documented at the first visit was ever acted on. Those are exactly the facts a record has to capture as facts if anyone is going to close the gap.
How we will know
A claim like this has to be tested in time, not in hindsight. This month Serelora submitted its first NIH application, in partnership with Atlanta Perinatal Associates.
It proposes two engines working together. One extracts the measurements and findings from prenatal records. The other applies SMFM #52 as fixed, visible logic rather than as a model’s judgment.
The test is concrete. The system’s output will be compared against a blinded physician panel on roughly 150 adjudicated pregnancies. It has to identify growth restriction within seven days of the earliest point the panel says it was identifiable. It has to do that with no more than 0.30 false alerts per pregnancy, a burden low enough for a silent prospective pilot in live care.
Dr. Onyeije’s broader program asks the harder question. It takes deliveries with birth weight below the 10th percentile at affiliated hospitals from 2020 to 2025 and classifies each one as identified, identified late, or missed. It then measures how many of the missed cases the record could have identified.
Fetal growth restriction is where we started, because pregnancy has a clock and the charts are dense. The method is not specific to it. It applies wherever a guideline triggers on a late signal while earlier ones sit documented and unused.
The test
Both schools will keep doing what they do well. Epic’s will keep answering questions that only a national network can answer. Ours has a narrower job. It builds the record so that the relevant evidence can be applied to one patient while the visit can still change the plan. Then it lets populations form from those readings.
You do not have to take this on faith. Pick any condition in your practice where the guideline triggers late. Read your own charts against it one patient at a time, and note where the earliest usable signal first appeared. Then ask whether anything in your record would have shown it to the physician in time.
If the answer is no, the missing piece is not more data. It is the reading that should have come first. A patient should not have to find another doctor to get it.
RELATED ARTICLES
Explore more insights and perspectives from our team.


